Subject Area: Spare Parts Inventory Management Theory
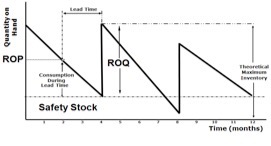
The classic ‘saw tooth’ diagram is often used to demonstrate and explain the theory associated with inventory management and control.
This diagram plots the available quantity of an inventory item over time as items are used and then replenished.
Figure 1 is an example of this diagram.
Here the horizontal axis represents elapsed time and the vertical axis represents the quantity on hand.
This particular figure also includes reference to some of the common terms and definitions as they relate to the classic saw tooth representation.
The key attributes of the theoretical model are the assumptions of linear demand (that is, average demand is constant over time) and instant and complete replenishment.
These attributes simplify the model but also make it irrelevant for spare parts inventory management.

Figure 1: The Classic Theoretical Saw Tooth Diagram
The problem is, of course, that reality almost never looks like the theoretical model.
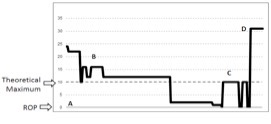
The truth is that for engineering and spare parts, the chart in Figure 2 is far more likely to be representative.
This graph has four characteristics that separate it from the theoretical profile.

Figure 2: Actual Component Demand/Supply Chart
First, for this particular component the initial parameter was to set a ROP of zero.
That is, there is no safety stock. This level is more common for engineering materials and spare parts than many people realize.
Second, in this specific case the ROQ was set to 10; hence, the theoretical maximum is 10 (ROQ + Safety Stock), however, for the majority of the elapsed time the actual holdings are much higher than 10.
Thus, a traditional or theoretical review of the ROP and ROQ would provide no improved understanding of how to manage this item because process and behavioral elements of inventory management have a far greater impact on the result than just the basic ROP and ROQ settings.
Third, this item has long periods of no movement followed by short periods of multiple movements.
Compare this to the theoretical model that assumes a constant and linear usage of items.
As a result the ‘average demand value’ (so often used in theory) varies enormously depending upon the period in the timeline; it is not constant or linear.
Fourth, the large spike in holdings on the right hand side (at the end of the timeline) is not a result of additional purchasing, but results from a massive and sudden return to store of items previously removed.
Thus the apparent cycle of usage at point C was not usage at all (although someone did remove the items from the storeroom) and the purchases made to replace these items were not actually necessary. (However, those doing the purchasing did not know this at the time, they were following their process.)
The problem was that the maintenance people who removed the items did not use them and did not advise anyone of this.
So, when they eventually had a cleanup and returned the items to the store, the item became overstocked, compared to the theoretical maximum, by 21 items or 210%!
This example shows that inventory management theory and the actual situation can be sufficiently different so as to make the application of simplistic solutions not only pointless, but also even dangerous to operational goals and company finances.
A smart inventory solution is to ensure that the influence, impact, and complicating factors of all the elements of materials and inventory management are considered.
It is precisely because the issues are many and the nuances subtle that here at SparePartsKnowHow.com we have developed as a platform to access a wide range of resources relating to spare parts inventory management and optimization.
Author: Phillip Slater