Subject Area: Qualitative Spare Parts Management Improvements
 Everybody loves hard data.
We measure and report all sorts of things: sales, costs, profit, loss, headcounts, inventory values, production volumes, expenses, vacation time, sick leave, stock turns, purchase volumes, operating effectiveness, debtors, creditors, weeks of stock on hand, asset values, revenue, equity, cash on hand, plant utilization, downtime, uptime, scrap generated, environmental emissions, cash flow, capital expenditure, return on investment, share price, depreciation.
The list seems almost endless.
All of the above (and I am sure that there are many more measures) are outcomes, they are the measurable effects of our actions.
And that is a major problem.
You see being an outcome we can’t measure the result until after the event.
Companies are ‘Looking in the Rear View Mirror’
When I worked as a production manager in manufacturing one of the major initiatives we undertook was to implement a quality control system. And one of the key elements of a quality control system is that you cannot rely on measuring outcomes.
Prior to this implementation it was not unusual that the first time anyone knew of a quality problem was when an inspector checked the product at the end of the production and packaging line. This was a recipe for disaster and checking quality ‘after the event’ was not (and is not) acceptable.
It is no surprise that modern quality control relies on measuring inputs and process settings rather than just checking final product.
Yet, in respect of inventory management improvements, many companies continually rely on data generated after the event. In the absence of a mechanism to check the ‘process settings’ companies are continually managing their inventory and specifically the way they improve their management approach by ‘looking in the rear view mirror’.
Measuring Qualitative Spare Parts Management Improvements Requires the Right Tool
Recently I have helped a multinational company both improve their approach to spare parts inventory management, and identify and implement opportunities for inventory optimization.
Measuring inventory optimization relies on hard data but measuring qualitative spare parts management improvements such as progress with policies, procedures, measures, and reporting needs something else. Measuring improvements in management systems cannot really be done with hard data, primarily because there are so many shades of grey.
To overcome this we utilized our Spare Parts Management Best Practice Matrix.
This tool enabled us to take qualitative data and convert it to a quantitative scale so that we could actually measure and demonstrate improvements. The matrix is based on our X-Ray Analysis and compares activity against four levels of performance to measure progress across 25 aspects of materials and spare parts management.
By applying the tool at the start of the program and then again 10 months later we could clearly see, in a simple snapshot, where improvements have been made and (perhaps more importantly) where improvements were still required.
This enabled us to produce charts similar to the chart below. This chart is a snapshot of the scoring in August (summarized by section). We can then redo the review the following year to clearly see the areas of improvement and the remaining gaps where more work is required.
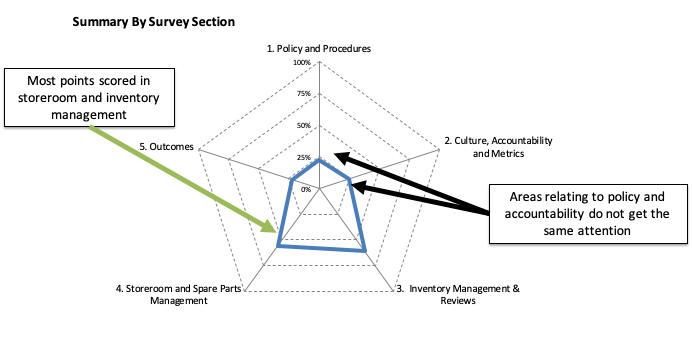
In addition we were able to convert the feedback into an absolute score and compare each site across the company network. Thus we converted a qualitative review into quantitative feedback.
And that is the key to measuring qualitative improvements: you need to make them quantitative.
Using the quality control analogy, you need to find a way to objectively measure the inputs to the process and the process settings (in this case policies, procedures, measures an reporting) so that you can be sure that the output is on track and will be what you expect.
For information on our spare parts management online training please visit our Pro Level page.
Posted by: Phillip Slater