In a previous post we demonstrated that the classic ‘saw tooth’ diagram associated with inventory management and control is sometimes not at all representative of reality for engineering materials and spare parts.
In this post, I am going to expand on this to show just how much it can cost your company if you fall into the trap of classic inventory management theory.
You will recall the diagram from last time that showed an actual component profile, shown here as Figure 1.
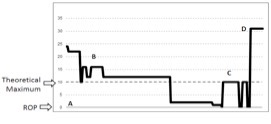
Figure 1: Actual Component Demand/Supply Chart
Falling into the trap of classic inventory management theory can happen when we use software to calculate the holding requirements without checking on the logic or results.
It is easy to see how this happens when you consider that people are often under pressure to review their inventory holdings and they have, say, 10,000 line items to review. Or if you have a ‘built in’ calculator that gets used in a matter-of-fact way.
However, blindly applying software could cost your company millions in unnecessary inventory purchases.
Let’s use the above component as an example. Here are some key data points for this component:
Average issue quantity: 22
Average issue frequency: 12 months
Maximum no. issued: 96
Minimum no. issued: 1
Lead time for supply: 8 weeks
The first thing to recognize is that the above chart does not reflect the data that the maximum number issued is 96 items. This is because, on those occasions, the receipt and issue happened in the same week. The chart plot uses a weekly value (rather than daily) so this volatility is in the data but not in the chart. Your computer software would not miss this the way that the chart plot does.
Now, let’s calculate the max-min holding levels using different inventory management approaches.
1. Poisson Function
Anecdotally, the item issues in lots of 10, so it might seem that a Poisson analysis is appropriate. Using a standard Poisson function, and seeking 99.9% coverage, suggests a reorder point (ROP)of 20. If we expect to issue 10 at a time we would most likely set the reorder quantity at 10. This gives a maximum holding of 30.
2. Gaussian Function
If we recognize, however, that the maximum number issued is 96 and the minimum 1, it is clear that the item is not issued in standard lots of 10. We then might apply a Gaussian, or Normal, function to work out the ROP and use the standard formula for the reorder quantity (ROQ).
For the ROQ, let’s use an item cost of $300, an order cost of $100 and a holding cost of 25%. These values yield an ROQ of 8. This is the economic order quantity, given the quantity used per year, the cost of ordering, and the cost of holding the stock.
To calculate the ROP I am going to use a Mean Average Deviation (MAD) rather than a standard deviation. This simplifies the calculation with little impact on the result. In this case we calculate the ROP using the formula:
ROP = (D x LT) + (csf x MAD x Sqrt(LT))
Where:
D = demand in units per week
LT = lead time in weeks
csf = customer service factor (determined from standard tables)
MAD = Mean Average Deviation
Sqrt = square root
Due to the high volatility in the demand for this item (maximum issued 96, minimum 1) the MAD is 24.3, which is very high. Assuming a required availability of 98% leads to a csf of 2.56.
Putting these and the other known values into the formula calculates a ROP of 180.
That’s right 180!
3. Logic and Understanding
What the data doesn’t tell us is that this company makes sure that all orders of cataloged items go through their storeroom and the usage of this item (which is a cataloged item) is forecast and planned. This is why, using logic, the original max-min was set at 10-0 and the larger quantities are ordered when needed.
Conclusion
Let’s compare the results of these three approaches:
1. Poisson: maximum holding 30 – cost to company $9,000
2. Gaussian: maximum holding 188 – cost to company $56,400
3. Logic: maximum holding 10 – cost to company $3,000
This clearly shows that applying inventory management theory can easily cost you tens of thousands of dollars per item! Conversely, applying the correct approach to existing inventory could save you 95% of the value invested (that means real money).
The message from this should be obvious: do not rely on software to recalculate your inventory holdings if you do not understand the algorithm being used and the relevance of its application. It’s not difficult to apply the correct approach, you just need to think about it in advance.
Click here for information on our Practitioner Playbook.
Posted by: Phillip Slater